Introduction
Blood pressure is comparable for males and females; however, the typical tendency is that the reading increases with age, therefore normal fluctuations tend to become higher for older persons. Female blood pressure is greater than male blood pressure after menopause, while after puberty, female blood pressure is lower than male blood pressure.
Studies have shown that blood pressure may be predicted by ethnicity, although this relationship is more likely societal than biological. When assessing the risk of hypertension, ethnicity must be taken into account as an influencing variable.
This article offers a blood pressure chart broken down by age and gender and explains how medical professionals distinguish between "acceptable" blood pressure and hypertension, or high blood pressure. (Aktiia, 2023)

What is An Age-Grade's Normal Blood Pressure?
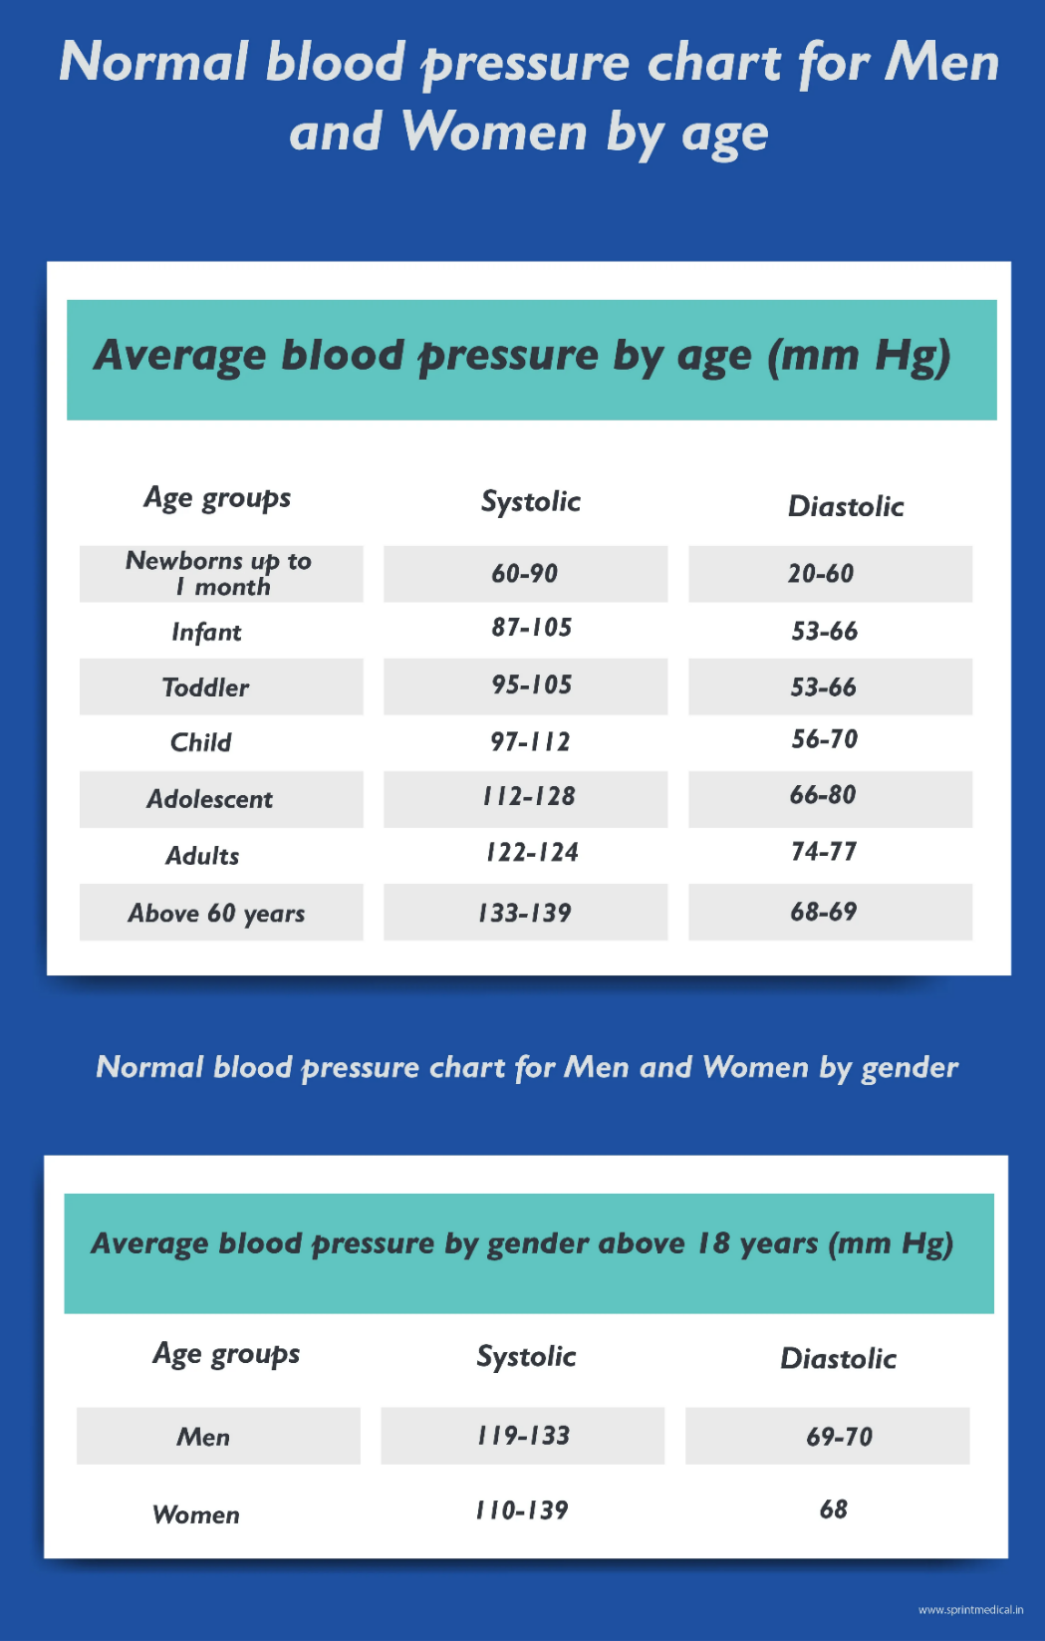
In children and teenagers, what is deemed "normal" blood pressure varies depending on age. (Lapum et al., 2018)
CATEGORY OF AGE | SYSTOLIC | DIASTOLIC |
infants up to one month old | 60 to 91 mm Hg | 20 to 60 mm Hg |
Youngsters | 87 to 105 mm Hg | 53 to 66 mm Hg |
Children | 95 to 105 mm Hg | 53 to 66 mm Hg |
Young children | 95 to 110 mm Hg | 56 to 70 mm Hg |
Children at school | 97 to 112 mm Hg | 57 to 71 mm Hg |
Teenagers | 112 to 128 mm Hg | 66 to 80 mm Hg |
Ages 18 to 39 | 110/69 mm Hg | 119/72 mm Hg |
Ages 40to59 | 123/74 mm Hg | 125/77 mm Hg |
more than 60 years | 138/68 mm Hg | 132/69 mm Hg |
CLASSIFICATION | SYSTOLIC | DIASTOLIC |
Typical | No more than 120 | No more than 80 |
Increased | 120 to 129 | Decreased 80 |
Hypertensive Phase 1 | 130 to 139 | 80 to 89 |
Hypertensive phase 2 | 141 or more | 91 or more |
Hypertension Crisis | Greater than 120 | greater than 180 |
What's the Relationship Between Age and High Bp and Why You Should Worry?
Some medical professionals concentrate on the first value, which is the systolic pressure. If you are aged than 50, a high systolic arterial pressure result is a significant indicator of heart disease. Age-related systolic hypertension is caused by a persistent plaque accumulation and arterial stiffness. Heart and vascular disorders are more likely to strike someone with elevated systolic blood pressure. Your vessels tend to stiffen with age, and plaque—a fatty substance—can accumulate inside of them, increasing blood pressure. Overly elevated blood pressure increases the tendency of coronary artery disease, sudden stroke, and other conditions. (Harvard health, 2018)
To identify high blood pressure, one can utilize either the diastolic or systolic blood pressure values. According to recent research, every 20 mm Hg hypertension or 10 mm Hg diastolic measurement increases the chance of mortality for those between aged of 40 and 89 from ischemic coronary artery disease or stroke by twice.
The mean heart rate for men and women globally in 2015 was 127/79 mm Hg and 122/77 mm Hg, respectively, according to a research analysis that was published in the Lancet.
Due to its widespread prevalence, high blood pressure has been given priority by the World Health Organization. A potential indicator of cardiovascular disease, one of the most prevalent illnesses and leading causes of mortality in England, is elevated blood pressure. (Lapum et al., 2018)

Conclusion
Irrespective of whether the purpose of the medical examination is to assess heart health, most examinations begin with taking a patient's blood pressure since it provides information to your medical team about how well their cardiovascular system is doing.
Age should be considered when interpreting blood pressure results. If you fall into an elevated range, your follow-up routine may change. What's typical for someone your age might be elevated for someone your age.
References:
1.Blood Pressure Table by Age | Aktiia. (2023, June 13). Aktiia.com. https://aktiia.com/uk/blood-pressure-by-age
2.Lapum, J. L., Verkuyl, M., Garcia, W., St-Amant, O., & Tan, A. (2018). What are Blood Pressure Ranges? Pressbooks.library.torontomu.ca. https://pressbooks.library.torontomu.ca/vitalsign/chapter/blood-pressure-ranges/
3.Baptist Health. (2022, November 4). Healthy Blood Pressure by Age and Gender (Chart) - Baptist Health. Www.baptisthealth.com. https://www.baptisthealth.com/blog/heart-care/healthy-blood-pressure-by-age-and-gender-chart
4.Harvard Health Publishing. (2018, April). Reading the new blood pressure guidelines - Harvard Health. Harvard Health; Harvard Health. https://www.health.harvard.edu/heart-health/reading-the-new-blood-pressure-guidelines
WRITTEN BY Checkme
Related Blogs
Recommended Products
Subscribe for special promotions,
healthy knowledge, and more!


